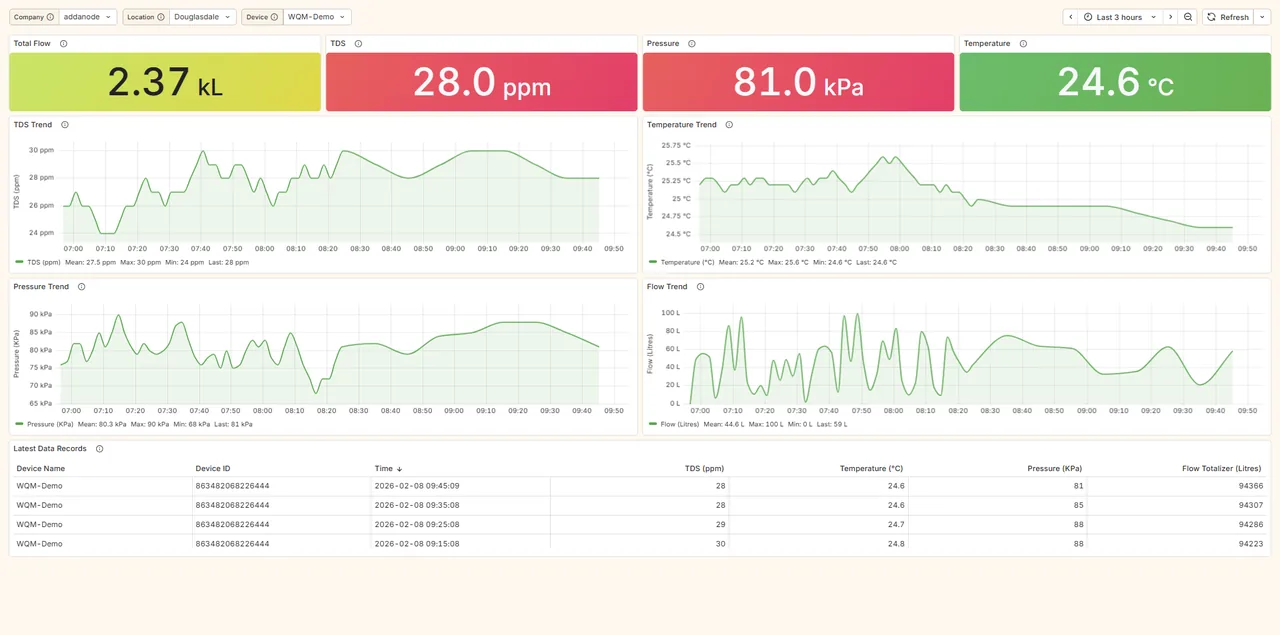
What the operator sees
Continuous quality on one screen: the parameters in your licence as live values with limits, trended, with the record table an inspector can be shown. The example below is a demonstration line; a licence dashboard carries pH, turbidity, conductivity, chlorine or COD surrogate in the same layout, with the compliance export behind it.